Mobile video accounts for 20% of digital ad spend in the UK and 53% of social media spend, while native ads now make up 20% of digital display ads, according to new research.

The latest Internet Advertising Bureau UK Digital Adspend report, conducted by PwC. found that total digital ad spend was up 16.6% to 6-month record £3.5bn.
Brits’ increasing appetite for watching video content on computers, tablets and mobile phones helped drive digital advertising.
The report found that video advertising on the internet and mobile phones grew by 59% year-on-year to £202 million in the first half of 2014. Mobile video advertising, alone, grew 196% to £63.9 million and is now the fastest growing digital ad format.

Accompanying online YouGov data reveals 73%¹ of Britons online who own an internet-enabled device watched TV programmes online in the last six months, 72% watched short online video clips and 59% watched films online. Those watching TV online average 2 hours 35 minutes¹ a week doing so, compared to 1 hour 50 minutes for online film viewers and 51 minutes for video clip viewers.
“A third of online viewers, particularly 35-44 year olds, are watching more TV, films and clips online than a year ago. Consequently, video now accounts for £1 in every £5 spent on internet and mobile display ads,” says Tim Elkington, Chief Strategy Officer at the UK’s Internet Advertising Bureau. “Average weekly viewing online amounts to 25 videos, 4-5 TV episodes and one film but what’s most interesting is that watching video on connected devices is becoming an increasingly social activity, like traditional TV. Half of people watching TV, films or video clips online do so with family members and three in ten watch with friends.”
Device owners in Scotland are the most likely to watch TV (78%)¹, films (66%) and video clips (82%) online. However, among online TV and film viewers, those in London average the most time online watching TV (3 hours 6 minutes per week) and films (2 hrs 27 mins) each week. Among video clip viewers, people in the south average the most time (1 hr 2 mins).
Total digital, native, social and tablet
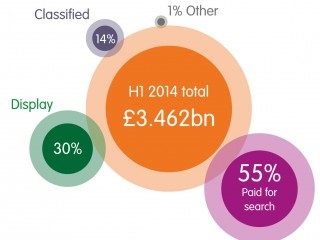
Advertising on the internet and mobile phones overall increased, like-for-like², by 16.6% or £467 million to £3.46 billion in the first half of 2014 – up from £3.0 billion in the first half of 2013.
Content and “native” advertising³ spend – which includes paid for sponsorships, advertisement features and in-feed distribution – hit £216 million, accounting for 21% of digital display advertising.
Social media ad spend grew 73% to £396.0 million, with 53% (£209.7 million) allocated to mobile.
Among media owners who submitted revenue figures to the IAB/PwC, tablet-dedicated advertising⁴ grew 160% to reach £29.0 million; up from £10.5 million.
Mobile ad spend up 68%; accounts for one-fifth of digital advertising
With smartphones accounting for over three quarters (76%)⁵ of handsets, mobile advertising grew 68% from £429.2 million to £707.1 million in the first half of 2014. Mobile now accounts for 20% of all digital advertising spend – up from 14% in the first half of 2013.
“Mobile’s share of the digital ad pie has tripled in two years, accounting for a fifth of total spend – rising to nearly a third of display and over half of social media ads,” says Dan Bunyan, Manager at PwC. “As 4G becomes more prevalent and phone screens become larger, it will play an even bigger role in driving digital ad spend – particularly video.”
Consumer goods and entertainment dominate mobile display advertising
Consumer goods advertisers spent the most on digital display advertising, overall, accounting for 16% share in the first half of 2014, followed by travel & transport (15%) and finance advertisers (13%). Consumer goods was also the biggest spender on mobile display ads – accounting for 23% share followed by entertainment & media (21%) and technology (12%) advertisers.
Digital advertising formats
Boosted by video and social media, display advertising across the internet and mobile grew almost twice the overall digital rate (16.6%) at 30.1% to £1.02 billion in the first half of 2014.
With mobile display growing by 116% to £315.7 million, mobile now accounts for 31% of total digital display advertising.
Paid-for search marketing increased 11.3% to £1.92 billion in the first half of 2014.
Classifieds including recruitment, property and automotive listings, grew 14.4% to £493.5 million – accounting for 14% of digital ad spend.
Methodology:
¹Source: YouGov Plc. Total sample size was 2065 adults. The survey was conducted online between 19-21 September 2014. The figures have been weighted and are representative of all GB adults (aged 18+).
²All growth rates except video and social media advertising are a like-for-like basis, i.e. only companies that submitted in H1 2013 and H1 2014 have been included in year-on-year growth calculations.
³Content marketing = paid for sponsorship, advertisement features, in-feed & native distribution tools.
⁴Tablet-specific advertising only (i.e. not including internet advertising displayed on a tablet by default).
