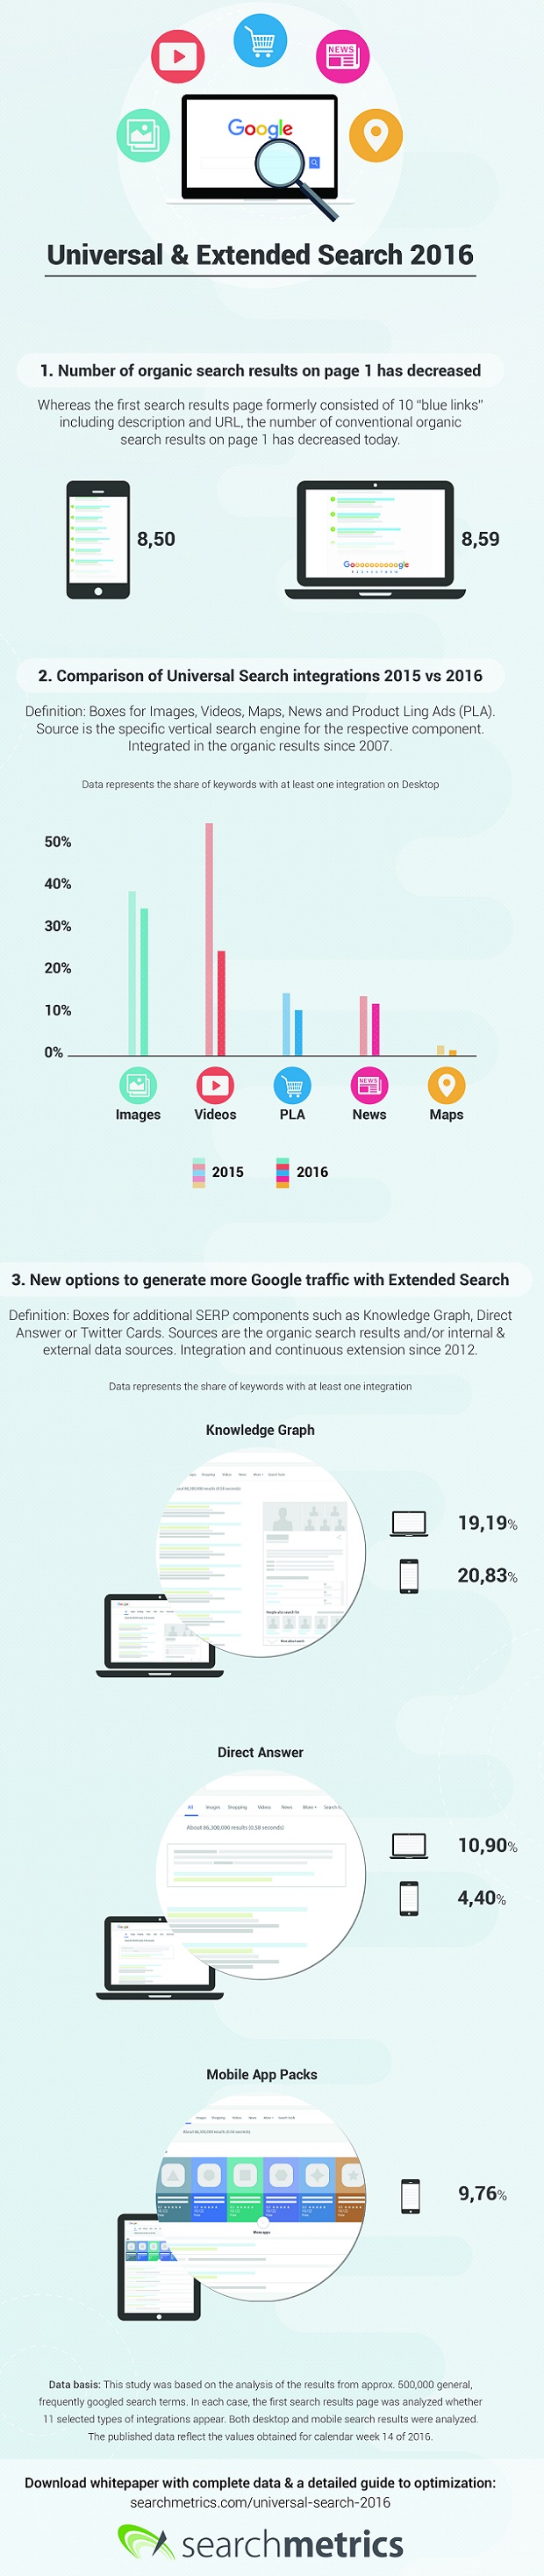
The first page of Google’s search results now displays fewer organic results, with around 8.5 links instead of the 10 it used to traditionally show, according to new research.
However, the study, from Searchmetrics, also indicates that nearly every search query now also includes at least one example of boxed out content such as app suggestions, Videos, Images, integrated Twitter cards on the first page giving marketers other ways of trying to get their web content into search results.
Searchmetrics analysed page one results for approximately half a million frequently Googled search terms to track where Google inserts boxed out content and integrations.
It is aimed at giving marketers an overview of the opportunities for targeting these box outs by creating and optimising content appropriately.
The study, which focused on Google’s US results, aims to give marketers an overview of the opportunities for targeting these integrations by creating and optimising content appropriately.
Five important findings highlighted in the study are:
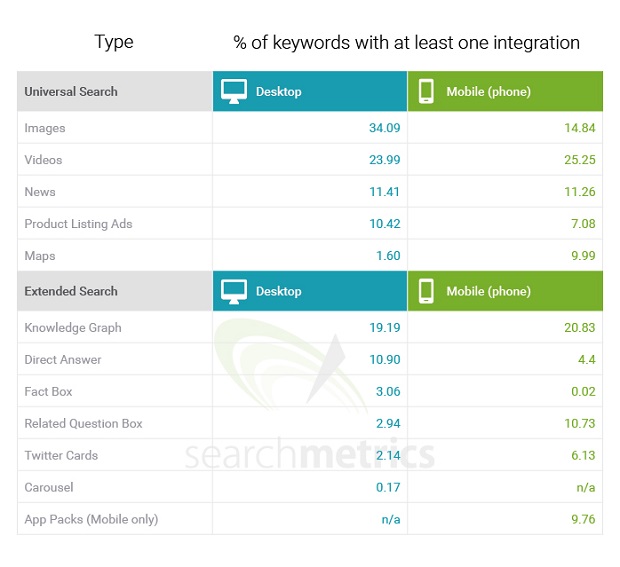
1) Desktop and smartphone searches feature different integration boxes
There are significant differences between Google’ smartphone and desktop results, with, for instance, 34% of desktop results including at least one Images box compared with only 14.4% for smartphones. This is presumably because Google is trying to discourage image-laden pages with long download times on smartphones.
Phone results also include more Google Maps and Twitter Card integrations and fewer Product Listing Ads integrations related to search queries.
The implication is that marketers must understand what integration types Google is more likely to feature on the different devices and use this to inform their content strategies.
2) Nearly one in ten smartphone searches includes app suggestions
In nearly one out of 10 (9.76%) smartphone searches, Google integrates at least one App Pack box suggesting one or more apps that are related to the search term. If you click on a suggestion, you are taken to the App Store to download it.
Appearing in App Pack boxes represents a significant opportunity to attract downloads and to transport searchers into the closed environment of your app. Marketers can try to increase their chances of inclusion by following App Store Optimisation (ASO) techniques, including carefully researching and selecting the keywords and descriptions used in their App Store titles and descriptions. The number and frequency of app downloads and positive user evaluations all play a role in whether Google chooses to include an app.
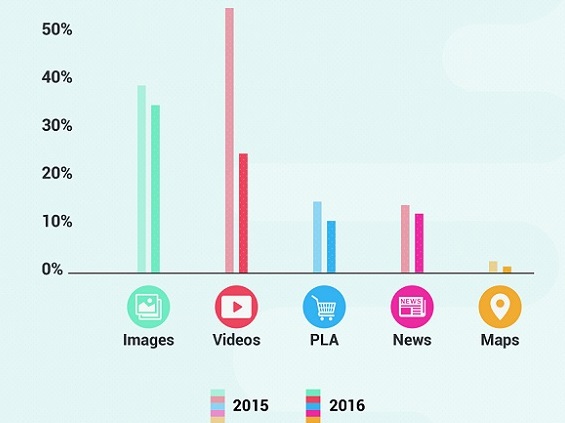
3) Videos boxes feature in around a quarter of results – and YouTube wins
Around a quarter of search results (23.99% on desktops and 25.25% on smartphones) now include at least one Videos integration. On desktops, 9 out of 10 videos tend to be hosted on YouTube making it the top platform to target if you want videos to appear in search results. On smartphones around 72% of videos integrated in results are from YouTube, with the others from the likes of Dailymotion, Vimeo and Vevo. To boost the chances of appearing in Videos boxes you should create clickable thumbnails of your video content that Google can easily include and use relevant keywords in titles and descriptions. Adding subtitles also helps (as Google understand text better than audio visual content), as does encouraging more user interaction in the form of likes and comments.
4) Knowledge Graph boxes are an opportunity for known brands
Around one in five search results feature at least one Knowledge Graph box, usually when search queries relate to a person, a place, or other known entities. Knowledge Graphs appear prominently on the right hand side of the search page (and on top of the page in mobile results) and include a collection of facts, images and answers related to the search topic, which might be a well-known public figure, business person or company for example. Google pulls this information together from online sources and known brands can have some influence on what appears when people search for them by optimising content such as logos/images, social network profiles and contact information. Having a company Wikipedia page is thought to be very helpful (although not easy for brands to control).
5) Direct Answer boxes are a high traffic opportunity
Google shows Direct Answer boxes for 11% of desktop results and 4% of smartphone results. These appear when the search engine senses that searchers are asking a question (very often when queries include the words ‘How’ or ‘What’). These boxes are positioned above the organic results and usually include content from a relevant search listing which searchers arrive at if they are click on the box. This can potentially generate a lot of organic traffic.
To have a chance of appearing in Direct Answer boxes, content needs to be well written, clearly ordered, reside on high authority sites and be structured using specific web code that helps Google understand it.
Key findings from the study are shown in the infographic below:
“Gone are the days when optimising for search was all about trying to appear in the classic ten blue organic links on Google’s first page,” said Lars Hartkopf, EMEA marketing director at Searchmetrics. “Now marketers must also plan their strategies to include opportunities around a variety of Universal and Extended Search boxes, understanding how to create and optimise content which Google will consider useful for each.”
The Searchmetrics Universal & Extended Search Study 2016 provides detailed explanations about the type of integrations boxes commonly used by Google, how often they appear in desktop and mobile searches and suggestions on how marketers can develop content that has a chance of appearing.
What wins in Google’s Universal and Extended Search?
The Searchmetrics Universal & Extended Search Study 2016 can be downloaded here
Methodology
This study was based on the analysis of the results from approx. 500,000 general, frequently googled search terms. In each case, the first search results page was analysed in relation to the integration of 11 selected boxes:
1. Images, videos, news, maps and product listing ads (PLAs) from Universal Search were investigated.
2. From the Extended Search, Searchmetrics analysed the Knowledge Graph, Direct Answer, Fact Box, Google Carousel, the mobile App-Pack integrations in addition to the Twitter Cards and the Related Questions.
Since Google frequently applies different rules depending on whether the search occurs on a desktop computer or mobile device, both desktop and mobile search results were analysed.
In the process, data from four time points in 2016 were recorded (calendar weeks 2 – 6 – 10 – 14) so that fluctuations and trends could be identified. The published data reflect the values obtained for calendar week 14 of 2016.