Attributable revenue from Facebook ad campaigns might be higher than web analytics lead them to believe, causing advertisers to report lower return on investment from Facebook, according to new research.
The study, from Rakuten Marketing, called The Facebook Measurement Divide,finds marketers relying solely on third-party analytics platforms are not realising all earned Facebook revenue and potentially missing as much as $4.7 million annually in lost attributable revenue.
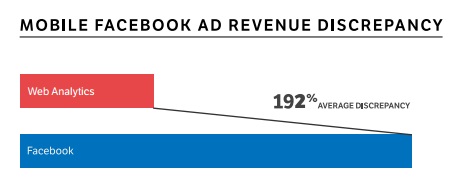
The analysis of client performance data revealed discrepancies between Facebook conversion tracking and web analytics that are obscuring 192% more attributable revenue and higher return on ad spend for mobile campaigns.
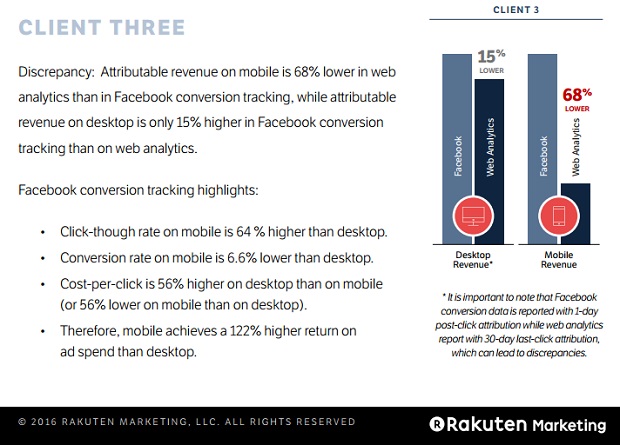
For one client included in the study, the attributable revenue from Facebook conversion tracking could be as high as £3.8 million annually, while their web analytics would report £1.6 million.
Rakuten Marketing analysed client campaign performance across Facebook advertising on desktop and mobile over a four-week period to determine consumer conversion performance.
According to the report, Facebook conversion tracking compared to markters’ third-party analytics reporting showed attributable revenue on Facebook is largely underreported for marketers. Conversion discrepancies cost some marketers more than 192 percent in attributable revenue and return on ad spend (ROAS) for their mobile campaigns. While a discrepancy between Facebook conversion tracking and third-party web analytics also exists for desktop campaigns, it is significantly lower, 3 percent on average, indicating cross-device identification as the primary cause. According to the report, these discrepancies are meaningful. For one client in the study, Rakuten Marketing estimated attributable revenue from Facebook could be as much as $4.7 million annually versus the $1.9 million reported through their third-party analytics.
The Facebook Measurement Divide provides data via client case studies, along with in-depth cross-device ad performance data; a breakdown of measurement challenges marketers face with cross-device marketing strategies; and best practices to help marketers improve overall campaign investment and performance.
“The findings of this report highlight that marketers need to be diligent about gaining transparency into their performance measurement,” said Tony Zito, CEO of Rakuten Marketing. “Innovation is affecting consumer behavior at a pace that does not allow for one-time attribution models that will accurately measure current and future marketing strategies. Our focus is to arm marketers with actionable insights that empower them to capitalise in the rapidly evolving landscape in which they compete.”
The analysis outlined in The Facebook Measurement Divide report is part of Rakuten Marketing’s growing investment in performance transparency and budget efficiency for marketers. Through this research, Rakuten Marketing has helped clients demonstrate the value of Facebook campaigns, and increase budget more than 20 percent to execute on strategic impertatives to invest more in mobile.
Source: www.rakutenmarketing.com