Apple significantly recaptured the number one position in mobile monetisation back from Android in Q3 2015, according to new research.
The Q3 2015 State of Mobile Advertising report y from Opera Mediaworks, attributed much of Apple’s rise to video and tablets.
Android first took the lead in Q1 2015 and held it through the entire first half of 2015. Now, over half (52.1%) of all advertising revenue on Opera Mediaworks’ mobile ad platform comes from Apple devices.
Overall highlights from the report include:
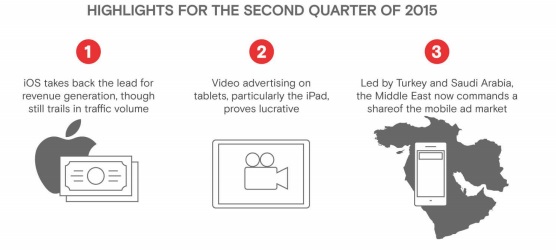
• iOS takes the lead for revenue generation
• Video advertising on tablets prove lucrative. Tablets as a whole (Android and iOS) have doubled their market share of impressions from last quarter
• Games is no. 1 for revenue. Games publishers accounted for 23.7% of revenue on the mobile ad platform, making it the top revenue-generator, beating out traditional leaders Social Networking and Music, Video and Media
• News and Information took the no. 2 slot for revenue generation (18.3%)
Much of that movement is driven by the iPad, which has boosted iOS’s position by doubling in volume to now account for 8.3% of impressions and 20.3% of revenue – generating more revenue per impression than any other device. Tablets as a whole (Android and iOS) have doubled their market share of impressions from last quarter and have shown over 2X the revenue potential than smartphones. Much of this is due specifically to the performance of video ads on tablets, with a revenue-to-impression ratio of 1.84 vs. 0.86 for smartphones.
“This quarter we saw some key monetization trends around video and high-value publisher categories that we believe will continue to fuel the healthy growth of the mobile advertising industry,” said Mahi de Silva, CEO, Opera Mediaworks. “At the same time, our own growth is very strong: We now reach over 1.1 billion unique users on our platform – up more than a third from Q3 2014 – and power mobile monetization of over 20,000 mobile sites and apps.”
More highlights from the report:
Games jumps to no. 1 for revenue, Social still king of impressions
• Games is no. 1 for revenue. Games publishers accounted for 23.7% of revenue on the mobile ad platform, making it the top revenue-generator, beating out traditional leaders Social Networking and Music, Video & Media. Games also has a high revenue-to-impression ratio (nearly 3X), which indicates its monetization potential.
• News & Information creeps up the rankings. News & Information took the no. 2 slot for revenue generation (18.3%) and for impression volume (17%), which is a boost from the 10% it captured in Q2.
• Social share slips, but still on top for traffic. Social Networking apps and sites continue to be served the most impressions (18.7%), albeit a dip from the high volume it had in previous quarters (around 31%).
Australia, United States show propensity toward mobile video ads
• Mobile video ads are most common in Australia. Oceania, dominated by Australia, leads the world when it comes to use of video advertising on mobile.
• The use of video advertising in the U.S. is 2X the global average. The United States’ share of global video impressions is 61% as compared to its 32% share of total ad impressions.
• Smartphone adoption catalyzes video growth. Emerging markets like the Middle East and Latin America are still below the 1:1 ratio (the global average), but they have progressed quickly and are closing the gap with more advanced markets like Europe and the United States. As these populations shift from less-internet-capable devices to Android- and iOS-powered smartphones, it is expected that these markets will see an increase in video ad formats.
Focus on the Middle East: Mobile behavior and monetization in top two markets
• Turks crave News & Information, Saudis are hooked on Games. Within the region, Turkey and Saudi Arabia have very high mobile internet penetration (measured as the percentage of internet users who can access the web with a mobile device) at 77.1% and 73.6% respectively. The way mobile users consume online media on their phones, however, is drastically different: Turkish users are hungry for News & Information (82% impression share) while the majority (55.9%) of traffic on Saudis’ phones is to Games, followed by Music, Video & Media (23%).
• Apps vs. web. These category trends impact the app/web breakdown. News & Information is mainly delivered in web format, so 68% of traffic in Turkey is on the mobile web. Games, however, are mostly apps; 88% of impressions in Saudi Arabia are to apps. Overall, the Middle East’s breakdown is 29% app, 71% mobile web – a striking difference from the United States, which is now 91% app and 9% mobile web.