US men use more apps, but Women spend longer on them, according to a new US study from Nielsen.
The study found that while men’s monthly app usage was a bit higher than women (27.2 vs. 26.3 apps, respectively), female users lead the way in terms of time spent.
Women spend an average of 38 hours and two minutes per month on apps while men spend 36 hours and 51 minutes per month.
Despite the increase in choices, the number of apps used is staying the same.
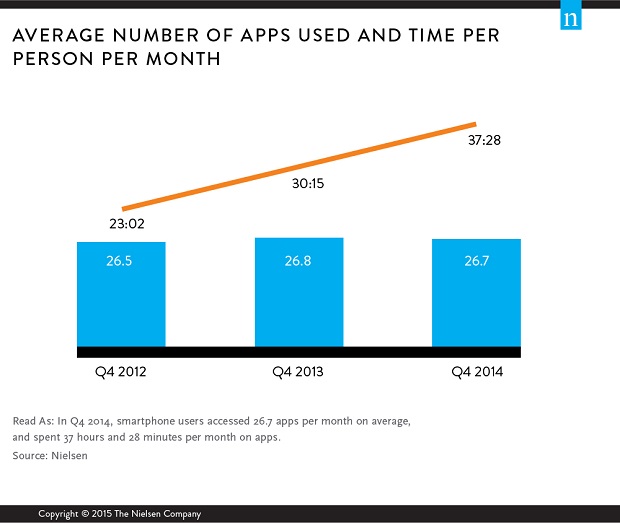
Nielsen analysis found that on average, U.S. smartphone users accessed 26.7 apps per month in the fourth quarter of 2014—a number that has remained relatively flat over the last two years. And consider this: Over 70% of the total usage is coming from the top 200 apps.
However, while there appears to be a consumer threshold to the total number of apps people are willing and/or able to actively use during the month, the time they spend engaging on those apps has increased.
In fact, the monthly time spent per person has increased from 23 hours and two minutes in fourth-quarter 2012 to 37 hours and 28 minutes in fourth-quarter 2014—a 63% rise in two years! So the reward for being one of the chosen apps is heavy engagement by the user.
The study also found that while men’s monthly app usage was a bit higher than women (27.2 vs. 26.3 apps, respectively), female users lead the way in terms of time spent. Women spend an average of 38 hours and two minutes per month on apps while men spend 36 hours and 51 minutes per month.
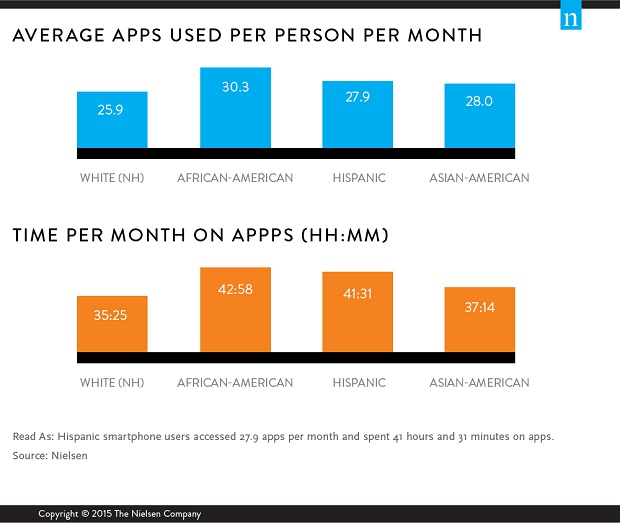
Another key takeaway from the analysis was the diversity of app usage among different races and ethnicities.
African-Americans not only use the most apps per month (30.3), but they are also spend nearly 43 hours per month on them. Hispanics spend 41 hours and 31 minutes (the second highest in time spent per month) across an average of 27.9 apps per month. Asian-Americans average 37 hours and 14 minutes per month, while white non-Hispanic users spend 35 hours and 25 minutes per month.
But what is powering the increased popularity of apps?
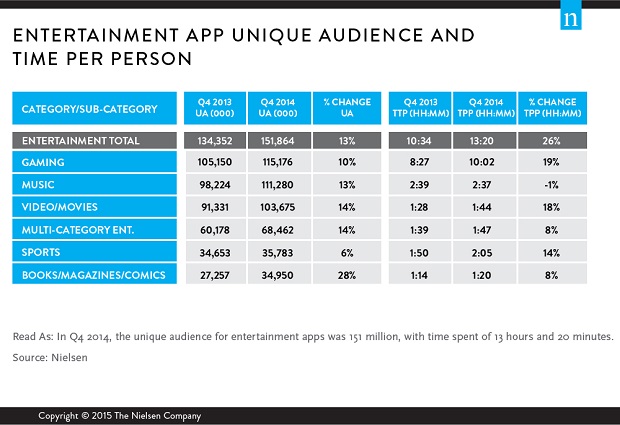
Nielsen found that the emergence of the entertainment categories is a contributor to the overall increase in app usage. In fact, not only has the entertainment category seen a 13% increase in unique audience year-over-year as of fourth-quarter 2014, but this audience is spending nearly three hours more on apps over the same period—a 26% growth.
The entertainment category comprises a variety of app functions, from those where consumers can check the weather to those that showcase the latest sports scores.
Nielsen found that when it comes to smartphone usage, the Gaming entertainment subcategory is the biggest draw. In fact, 76% of entertainment app users (115 million) played at least one game in fourth-quarter 2014, and time spent on gaming increased by 1:35 per month to 10:02.
Music is the second most popular subcategory, with a 13 million increase year over year among users.
Meanwhile, video/movies grew to nearly 104 million users and 1:44 per month.
METHODOLOGY
Insights about mobile app usage were gathered using Mobile NetView 3.0, Nielsen’s on-device software, which is installed with permission on panelist smartphones (approximately 5,000 panelists ages 18+ with Android and iOS handsets). The panelists are recruited online in English and include Hispanic, African-American and Asian-American consumer representation.