


TV accounted for 93.8% of video ads viewed in the UK in 2016, representing 18 minutes and 53 seconds a day watching commercials, according to new research.
The study new figures from Thinkbox, also indicates that this number is much lower for younger adults aged between 18-24.
This figure is a slight decrease from 2015, where TV’s share was 94.4%, but is still significantly higher than all other forms of video advertising.
YouTube accounted for 0.7% of viewed ads in 2016 (up from 0.5% in 2015 ), while other online video, including Facebook, collectively accounted for 5.2% (up from 4.7% in 2015 ). Cinema accounted for 0.4% of video ad views.
Overall, the average person in the UK watched 20 minutes of video ads a day in 2016.
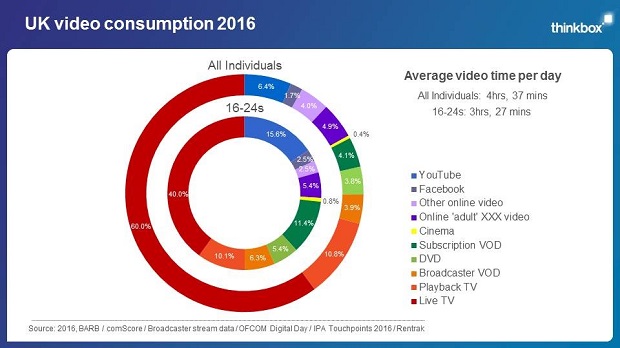
Meanwhile, total video consumption increased year-on-year from an average of four hours, 35 minutes a day to four hours, 37 minutes. TV accounted for 74.8% of UK video viewing in 2016, compared with 76% in 2015.
Key findings
TV accounts for 74.8% of UK video viewing
This compares to 76% in 2015. Total video consumption increased year on year from an average of 4 hours, 35 minutes a day in 2015 to 4 hours, 37 minutes in 2016.
TV’s proportion of total video viewing breaks down as follows:
• Live TV: 60% of total video viewing (61.6% in 2015)
• Playback TV (recorded and watched at a later time): 10.8% (11.4% in 2015)
• Broadcaster VOD: 3.9% (3% in 2015)
The analysis also shows that:
• YouTube accounted for 6.4% of average video viewing in 2016, up from 4.4% in 2015
• Online adult video accounted for 4.9% in 2016, compared with 4.4% in 2015
• Subscription VOD services – including Netflix and Amazon Prime – collectively accounted for 4.1%, compared with 4% in 2015
• DVDs increased their share of video time from 2.9% in 2015 to 3.8% in 2016
• Facebook was 1.7%, down from 2.2% in 2015
• Cinema was 0.4% in 2016, unchanged from 2015
TV accounts for 56.4% of 16-24s’ video viewing
This compares with 57.6% in 2015. 16-24s watched less video in total than the UK average: an average of 3 hours, 27 minutes of video a day in 2016, up from 3 hours, 25 minutes in 2015.
YouTube accounted for 15.6% of 16-24s’ video viewing in 2016, up from 10.3% in 2015. YouTube’s increase appears to have been at the expense of Facebook and other online video. Facebook’s proportion of 16-24s’ video viewing dropped from 5.7% in 2015 to 2.5% in 2016. Other online video – including video found on newsbrands’ and magazine websites, other video services such as Vimeo, and the long tail of online video – shrank from 6.6% in 2015 to 2.5% in 2016.
TV accounts for 93.8% of video ad viewing
The average person in the UK watched 20 minutes of video advertising a day in 2016. TV advertising accounted for 93.8% (18 minutes, 53 seconds a day), compared with 94.4% in 2015. TV advertising is watched full screen, regardless of the device it is watched on, and most likely with the sound on.
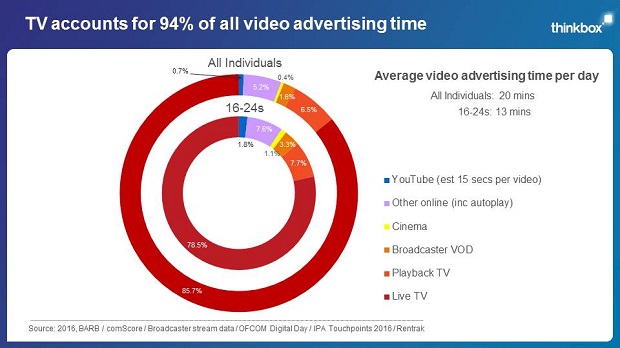

Other forms of video advertising break down as follows:
• YouTube accounted for 0.7% of the video advertising that was seen in 2016, up from 0.5% in 2015
• Other online video (including Facebook, for which specific data is unavailable) collectively accounted for 5.2%, up from 4.7% in 2015
• Cinema accounted for 0.4%, the same proportion as in 2015
1
TV accounts for 89.5% of video ad viewing for 16-24s
This compares with 88.6% in 2015. 16-24s watched an average of 13 minutes of video advertising a day in 2016. TV accounted for 11 minutes, 31 seconds of this total.
YouTube accounted for 1.8% of 16-24s’ video ad viewing in 2016 (up from 1.3% in 2015); other online (including Facebook) was 7.6% (9.2% in 2015); and cinema was 1.1% (0.9% in 2015).
Lindsey Clay, Thinkbox CEO: “It is important that advertisers have as clear a view as possible of how the video world looks so they can make informed decisions.
“The available data clearly shows that TV is the pre-eminent form of video. However, scale is only one part of the story. An analysis like this can’t include things like relative quality and trust, the amount of premium content different video have to offer and, ultimately, advertising effectiveness. In these areas too TV stands out.
“TV is a trusted, high quality environment for advertisers that is proven to work. It has a huge variety of premium programming across every genre and can satisfy the demands of many thousands of advertisers simultaneously and for the long-term. Now more than ever these are crucial distinctions between it and a lot of other types of video.”
TV advertising investment totalled £5.28 billion in 2016
Recently released figures show that TV ad revenue in the UK totalled £5.28 billion in 2016, up 0.2% on 2015, according to full year revenue figures provided to Thinkbox by the UK commercial TV broadcasters. This represents the seventh consecutive year that TV advertising revenue has grown in the UK. The figure represents all the money invested by advertisers in commercial TV across all formats and on every screen: linear spot and sponsorship, Broadcaster VOD, and product placement. Online businesses invested a total of £639 million in TV, an increase of 8% on 2015, to become the largest category of advertisers on TV.
The video analysis combined 2016 data from Barb (Broadcasters’ Audience Research Board), comScore, the IPA’s Touchpoints 2016 study, Ofcom’s 2016 digital day study and Rentrak box office data to give a like-for-like comparison of estimated video consumption in the UK.