


The amount companies have spent on mobile display ads has overtaken that of PC and tablet display for the first time, according to new research.
The study, from the IAB and PWC, indicates that women and youngsters aged 16-24s now spend more internet time on their mobiles than on PCs.
The study found that advertisers increased spend 16.4%bin the first half of 2016 to £4.78 billion – the highest first half growth rate for two years.
The PwC / Internet Advertising Bureau UK Digital Adspend report also shows the amount spent on mobile display ads (£802 million) overtook that of PC and tablet display (£762 million) for the first time.
This significant development reflects the rapid growth of time spent on smartphones: UKOM, the official body that measures online behaviour, shows that in June, UK adults spent 46% of their internet time on a mobile compared to 41% on a desktop or laptop – rising to 52% on mobiles among women and 61% among 18-24s.
Total mobile ad spend, including search and classifieds, increased by 56.1% in the first half of 2016. Consequently, 36p in every £1 spent on digital advertising now goes to mobile, up from 4p just five years ago.
“Mobile use today is more akin to a computer than merely a phone, as people increasingly rely on them as their information, entertainment and communications hub,” said the IAB UK’s Chief Strategy Officer, Tim Elkington. “People now spend more time online on their mobile than they do on a computer. Consequently, marketers devote more ad spend to mobile as they increasingly cotton on to the fact that people essentially carry an ad platform with them wherever they are.”
Accompanying online YouGov consumer data shows that 82% of smartphone owners check their phone within an hour of waking up, while 86% of 18-34s do so within half an hour. For 1 in 5 of those looking at their phone soon after waking up, checking social media is the first thing they do, rising to 29% of 18-34s. The smartphone is now the primary source of news for 30% of owners, rising to 42% among 25-34s.
Video, social and native are fastest-growing formats
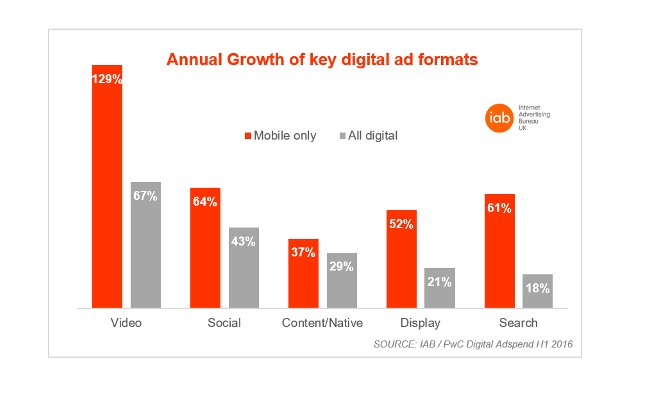
Spend on video ads overall grew 67% to hit £474 million during the front half of 2016. Driven by rising video, TV and film viewing on smartphones, mobile video spend alone grew 129%.
Consequently, video accounts for 30% of all display advertising but 37% of mobile display.
Outstream and in-read video ads (those appearing anywhere on the page, not before video content) saw a massive 440% rise and now account for 40% of video spend, whilst ‘traditional’ video ads (which play before, during or after an online video) grew 17%.
Annual growth of key digital ad formats
Ad spend on social media sites grew 43% to £745 million, meaning nearly half (48%) of display spend now goes on social. Social media spend on mobile alone grew 64%, so mobile now accounts for 80% of spend allocated to social.
Content and native advertising spend – which includes ‘advertorials’ and ads in social media news feeds – increased 29% to £451 million.
Consumer goods are biggest display advertisers
Consumer goods brands – such as food, toiletries and clothing – spent the most on display ads (e.g. banners and video), responsible for 18.3% of spend, followed by travel & transport (16.4%) and automotive (11.7%).
Driven by mobile, which grew 61%, paid-for search overall grew 18.1% to £2.49bn – a 52% share of digital ad spend. Classifieds, including recruitment, property and automotive listings, grew 3.6% to £699 million (15% share).
“The phenomenal rise of mobile search reinforces the idea of mobile as the ever-present ad medium,” says Dan Bunyan, Senior Manager at PwC. “It means advertisers no longer have to wait to target people at specific ‘touchpoints’ during the day. Instead they can deliver highly relevant, localised ads with unprecedented immediacy, such as reacting to people reaching a specific place, looking for a particular product or even the weather changing.”
Methodology
All growth rates unless stated are a like-for-like basis (except for social media, overall video advertising, outstream video advertising and content/native advertising), i.e. only companies that submitted in 2015 and 2016 have been included in year-on-year growth calculations.
Source: www.iabuk.net.