


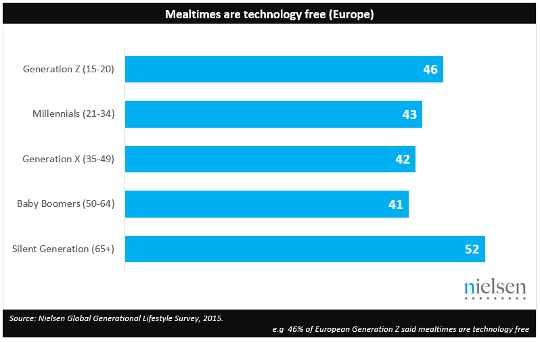
Fewer than half (43%) of Europeans say their household mealtimes are technology-free, but it’s middle-age diners who are most likely to involve some form of tech – such as TVs or smartphones – when they sit down to eat, according to new research.
The study, from Nielsen’s Global Generational Lifestyles report, surveyed 30,000 online respondents in 60 countries to better understand how consumer behaviour differs across life stage.
Although only 46% of Generation Z (15-20 year olds) and 43% of Millennials (21-34s) across Europe reported that domestic mealtimes are tech-free, even fewer people aged 35-64 said the same. The Silent Generation (65 years+) are the most likely to have tech-free mealtimes in their homes, but that’s still only the case for just over half this age group (52%).
In the UK, only half of people (50%) say their household mealtimes are free from technology.
“Millennials may have the biggest reputation for being glued to their connected devices, but older respondents are more likely to be distracted in this way during mealtimes at home than their younger counterparts,” says Nielsen EVP of advertising solutions for Europe, Terrie Brennan. “It’s a sign that today’s consumers are bucking yesterday’s preconceived generational notions and, in fact, many older people are embracing a more technology-driven world.”
Myths around technology news sources
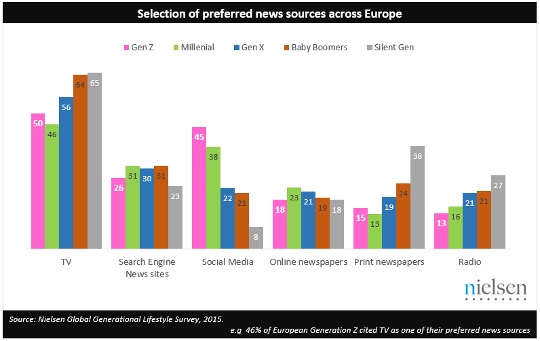
The report findings also question other myths around polarisation of the young and the old. Across Europe, the youngest and oldest generations – Generation Z and the Silent Generation – are equally as likely to cite newspaper websites (18%) as a preferred source of news, while the youngest are only a little more likely than the oldest to cite TV news websites (16% vs 14%) and search engines (26% vs 23%).
Differences do come around social media. Generation Z (45%) is nearly six times as likely as the Silent Generation (8%) to cite social media as their preferred news source. In contrast, the oldest generation is more than twice as likely as the youngest to cite print newspapers (38% vs 15%) and magazines (15% vs 7%).
Ms Brennan again: “Aside from social media and print, the age skew on some preferred news sources is not what you might think. While around two-thirds of Europeans over 50 turn to TV to get their news, TV is still a preferred news source for half of Generation Z and nearly half of Millennials (46%).”

Myths on leisure activities
Although Generation Z (20%) are 10 times more likely than the Silent Generation (2%) to use their spare time playing video games, the former aren’t technology obsessed. This youngest generation is more likely to spend its spare time in contact with family and friends (29%), playing sports (24%) and reading (23%) than it is to be playing video games.
Ms Brennan concludes: “Just as older people are increasingly embracing technology, sizeable numbers of younger people are turning to more traditional pastimes. Yes, there are differences between the generations. But when it comes to using technology, in many ways it’s remarkable how similar we are.”
The full report, which covers how the generations live, eat, play, work, save and their aspirations is available here.
Methodology
The Nielsen Global Survey of Generational Attitudes polled more than 30,000 online consumers in 60 countries throughout Asia-Pacific, Europe, Latin America, the Middle East/Africa and North America. The sample includes Internet users who agreed to participate in this survey and has quotas based on age and sex for each country. It is weighted to be representative of Internet consumers by country. Because the sample is based on those who agreed to participate, no estimates of theoretical sampling error can be calculated. However, a probability sample of equivalent size would have a margin of error of ±0.6% at the global level. This Nielsen survey is based only on the behavior of respondents with online access. Internet penetration rates vary by country. Nielsen uses a minimum reporting standard of 60% Internet penetration or an online population of 10 million for survey inclusion.