


The average viewer in the UK watched a total of 3 hours, 51 minutes of TV a day in 2015, with VOD services such as YouTube and netflix taking only 8.4% of this, according to new research.
The study, from Thinkbox looked at 2015 figures for all TV viewing in the UK on any screen.
Key findings:
The average TV viewer in the UK watched a total of 3 hours, 51 minutes of TV a day in 2015, 1% less than in 2014 but 5% more than in 2005. This figure, compiled by Thinkbox, comprises all TV viewing watched on any screen in 2015.
For the average viewer, 3 hours, 47 minutes of TV a day is watched on a TV set; 4 minutes is watched on other devices, such as tablets, smartphones and laptops.
16-24s watched an average of 2 hours, 24 minutes a day of TV in 2015, which breaks down as 2 hours, 14 minutes a day watched on a TV set and 10 minutes watched on other devices. This is 7% less than 2014 and 8% less than 2005. However, TV remains by far the most popular form of video for this age group (see below).

Representing modern TV viewing
Previously, Thinkbox has reported only the UK industry standard measurement for TV viewing – viewing on a TV set within 7 days of the original broadcast, as measured by the Broadcasters’ Audience Research Board (BARB) – together with streaming data from the UK Broadcasters for TV viewing on other devices.
However, as TV viewing has developed, BARB’s figures show that an increasing amount of viewing on a TV set now falls outside standard measurement. An estimated 6.5% of all TV viewing in 2015 fell outside the industry standard. Among 16-24s this increases to 14%.
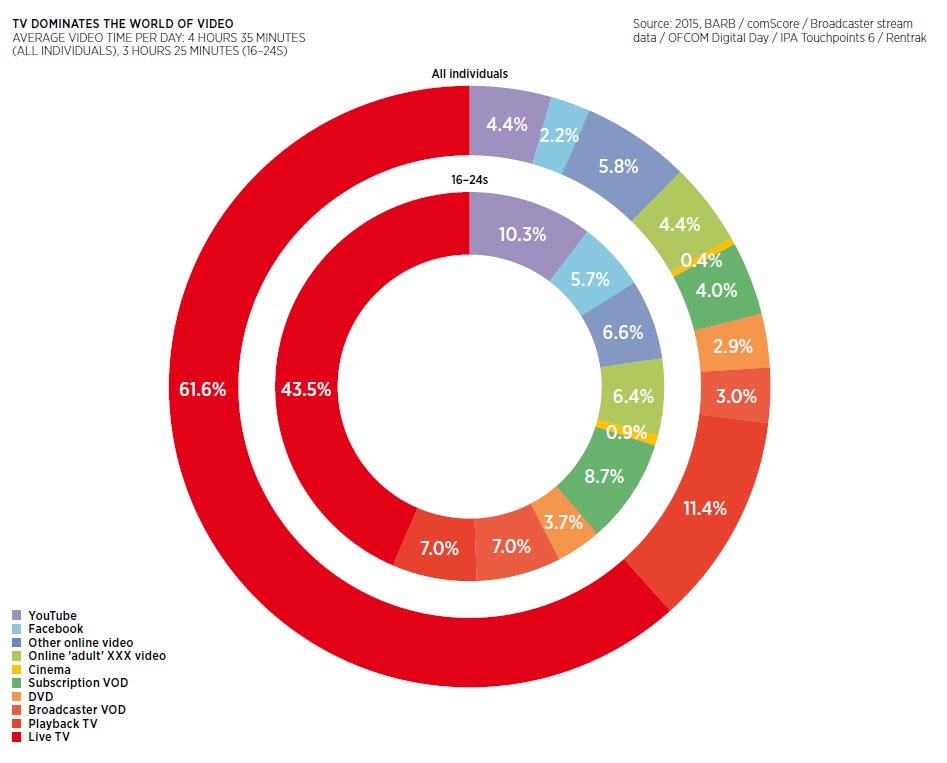
Total video viewing has increased by 15 minutes a day
According to a new Thinkbox analysis of video viewing – combining comScore data with BARB data, Broadcaster VOD stream data, Rentrak box office numbers and calibrating this metered/census level data with the IPA’s Touchpoints study – the total amount of video the UK is watching has increased. In 2015, the average person in the UK watched 4 hours, 35 minutes a day of video in all its different forms, an increase of 15 minutes a day since Thinkbox first analysed total video time in 2014.
TV accounts for 76% of video time
TV – live, playback or on-demand across all screens – had a 76% share of total video viewing in 2015. This share is down from 81% in 2014, however this is set against the increase in the overall amount of video being watched. In 2015, the average person in the UK watched just 3 minutes less TV a day than in 2014.
YouTube accounts for 4.4% of video and SVOD 4%
In the UK, YouTube has grown as a proportion of total video in the last year, up from 3.5% in 2014 to 4.4% in 2015. Online ‘adult’ video also accounts for 4.4% of total video, down from 4.6% in 2014.
Subscription Video on Demand (SVOD) viewing – comprised of Netflix, Amazon Prime and other SVOD services – has also grown. In 2015, SVOD accounted for 4% of total video, up from 2.3% in 2014. It is probable that a significant proportion of SVOD growth has come at the expense of DVDs, which accounted for 3.8% of video in 2014 but 2.9% in 2015.
Video viewing on Facebook accounted for 2.2% of total video in 2015, with all other online video – which ranges from that watched on sites such as Vimeo and newspaper and magazine websites through to the long tail of online video – accounting for 5.8%. Year-on-year comparison data for Facebook and all other online video is not available as they were not looked at separately in the 2014 analysis.
Disputed findings
The findings are at odds with recent stats from YouTube, which found that UK watch time on the video sharing site has grown 60% year on year. This is twice the growth rate that the Thinkbox data suggests, which puts YouTube watch time at just 30% year-on-year)
Globally, the time spent watching YouTube has increased an average 50% for three straight years, according to Google.
TV dominates young people’s video world
16–24s in the UK watched an average of 3 hours, 25 minutes of video a day in 2015, with TV accounting for 57.5% of the total. They watched over twice as much Broadcaster VOD as the average (7% vs. 3%), twice as much YouTube (10.3% vs. 4.4%) and twice as much SVOD (8.7% vs. 4%).
Younger people are spending more time watching TV and other forms of video online thanks to screens like tablets and smartphones. 38% of 16-24s’ video viewing is on devices compared with 20% for all individuals.
Lindsey Clay, Thinkbox CEO: “TV has expanded in recent years into new times and places; the way we watch TV is changing. We need to show as accurate a picture as possible of how much TV we are watching – and where TV sits in the emerging video world. With so many different forms of video out there it can be confusing so it is important to get a grip on what is really happening.
“These new figures show that TV dominates the video world for all age groups. Today’s young people watch on-demand forms of video more than the generations before that didn’t grow up with them. This makes sense as they do not tend to have control of the TV set and so turn to their personal screens to watch what they want. What is remarkable is that in the last decade, when so many new technologies and services have arrived that could have disrupted TV, TV viewing has remained so dominant.”
Source: thinkbox.tv